Spot gold traded near $4,812/oz in early Asian hours on Thursday. Prices trimmed gains after hitting a record high of $4,888.17/oz on Wednesday, as US President Donald Trump rolled back some of his hardline threats related to Greenland, easing geopolitical tensions.
Meanwhile, WTI crude hovered around $60.57/barrel, after oil prices surged more than 3.6% on Wednesday, supported by supply concerns tied to Kazakhstan oil field disruptions and slow progress in Venezuela’s export recovery.
Gold
Gold prices pulled back from record highs on Wednesday as geopolitical tensions eased following President Trump’s decision to soften his stance on Greenland, triggering a rebound in equities and reducing demand for safe-haven assets.
Spot gold rose 0.3% to $4,778.51/oz, after briefly surging to an all-time high of $4,888.17/oz. US gold futures settled 1.5% higher. Analysts noted that the withdrawal of tariff threats against Europe boosted risk sentiment, prompting partial profit-taking in gold. However, the move is widely seen as a short-term consolidation rather than a trend reversal.
Gold surged 64% in 2025 and is already up 11% year-to-date in 2026, underlining the strength of the broader uptrend.
Technical Outlook:
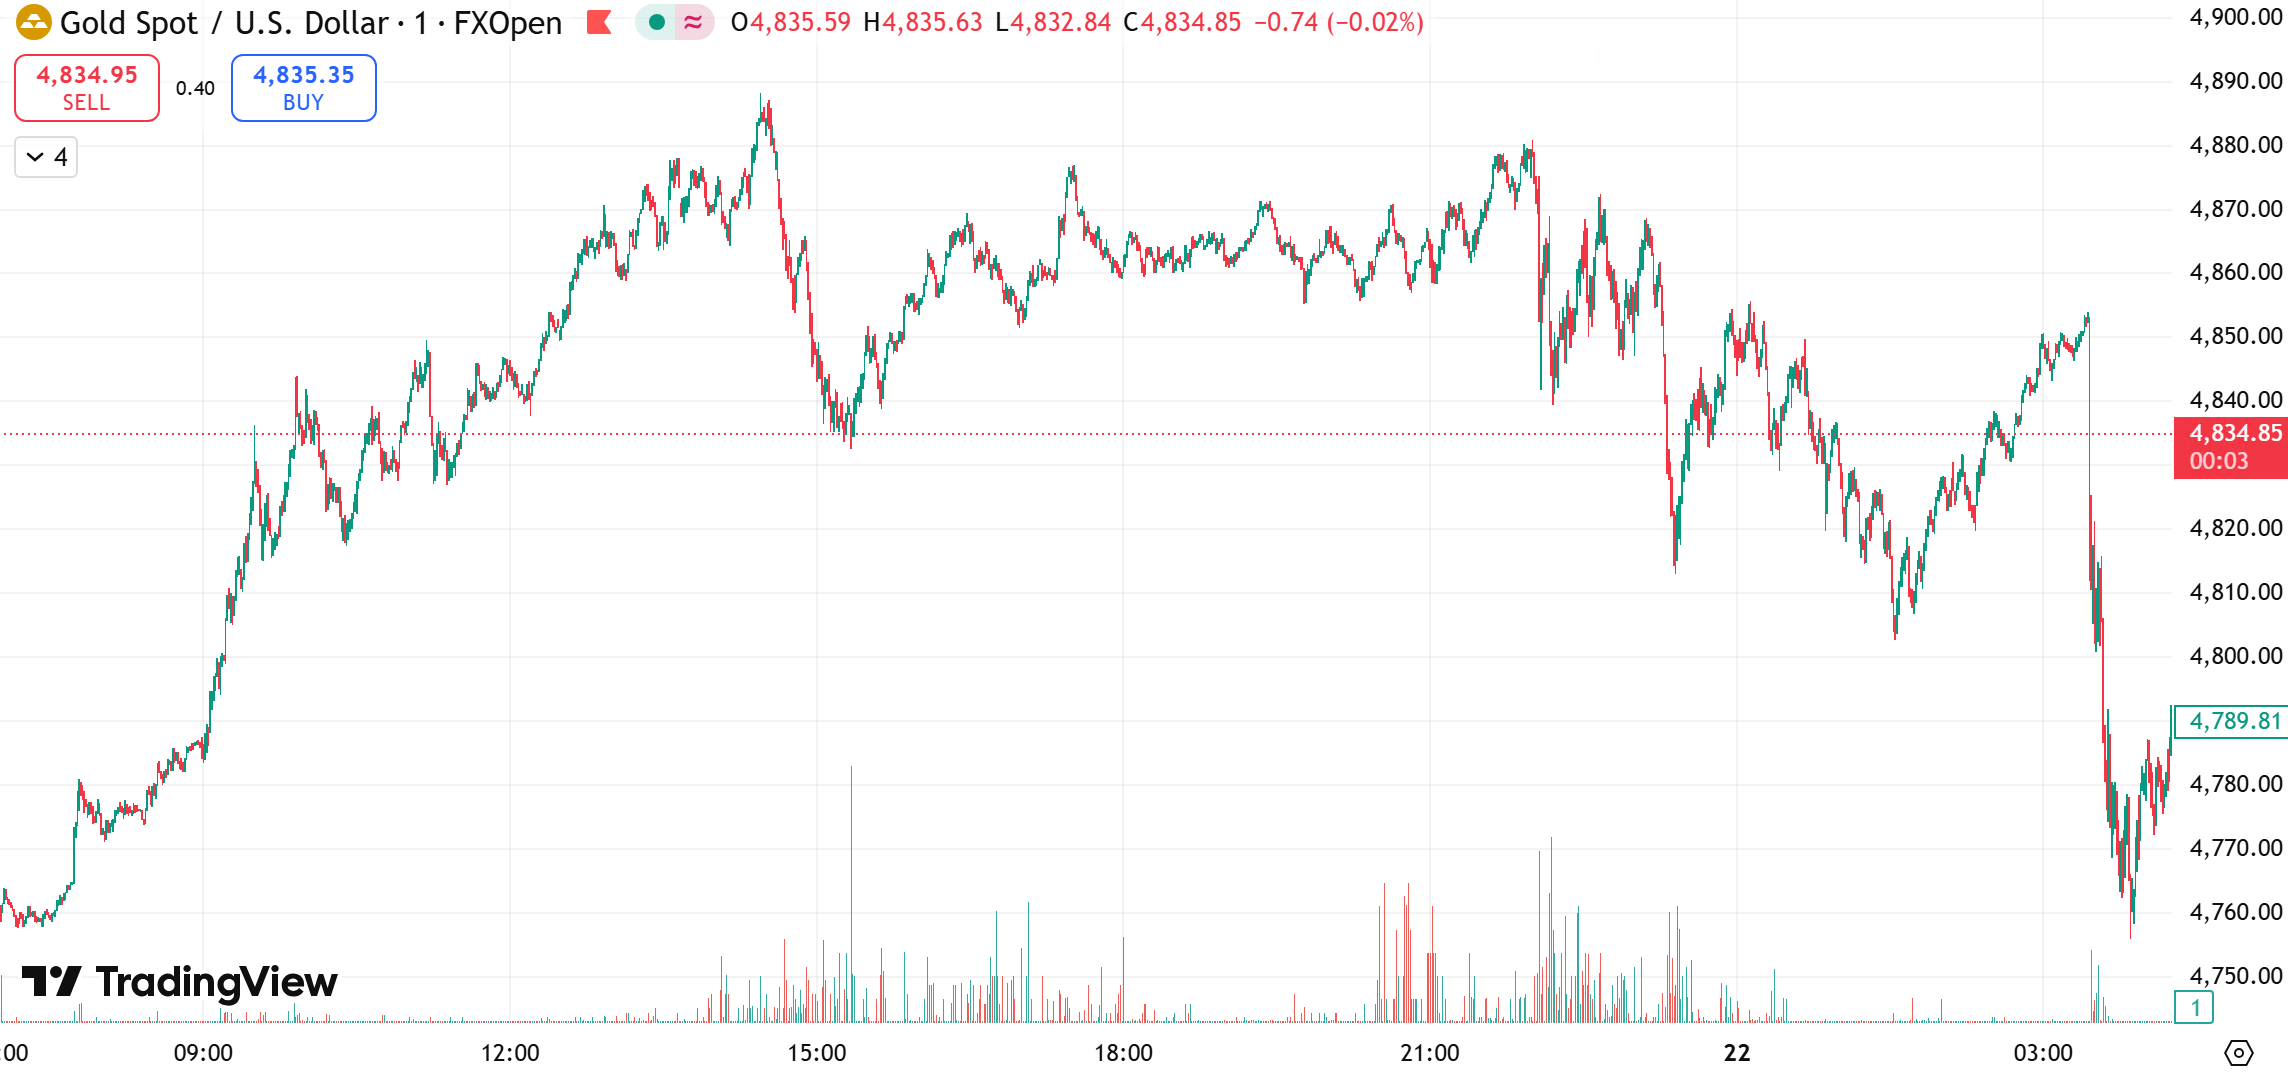
From a daily chart perspective, a deeper pullback may be developing, with price action suggesting a potential topping structure. A confirmed breakdown below the 5-day and 10-day moving averages would strengthen the case for a larger January correction. Key daily supports are located at 4,730 and 4,650, with 4,650 remaining the critical level that defines the broader bullish structure.
On the H4 timeframe, Bollinger Bands have begun to contract, and the overnight decline has already pushed prices below short-term moving average support. A clear break below the mid-Bollinger band near 4,730 could open the door toward 4,600 or lower. On the upside, resistance is seen near 4,835 and 4,855, where selling pressure may re-emerge.
Today’s Focus:
Strategy: Buy dips, sell rallies cautiously.
- Upside resistance: 4,855–4,875
- Downside support: 4,800–4,770
Oil
Oil prices closed higher on Wednesday, supported by supply disruption concerns stemming from Kazakhstan and a sluggish recovery in Venezuelan exports. Brent and WTI crude rose 0.5% and 0.4%, respectively.
On the supply front, production at Kazakhstan’s Tengiz oil field was halted after a force majeure event disrupted pipeline flows to Black Sea terminals. The outage is expected to affect output for seven to ten days. Meanwhile, Venezuela’s oil exports have been slow to recover under its agreement with the US, limiting its ability to fully reverse recent production cuts.
Technical Outlook:
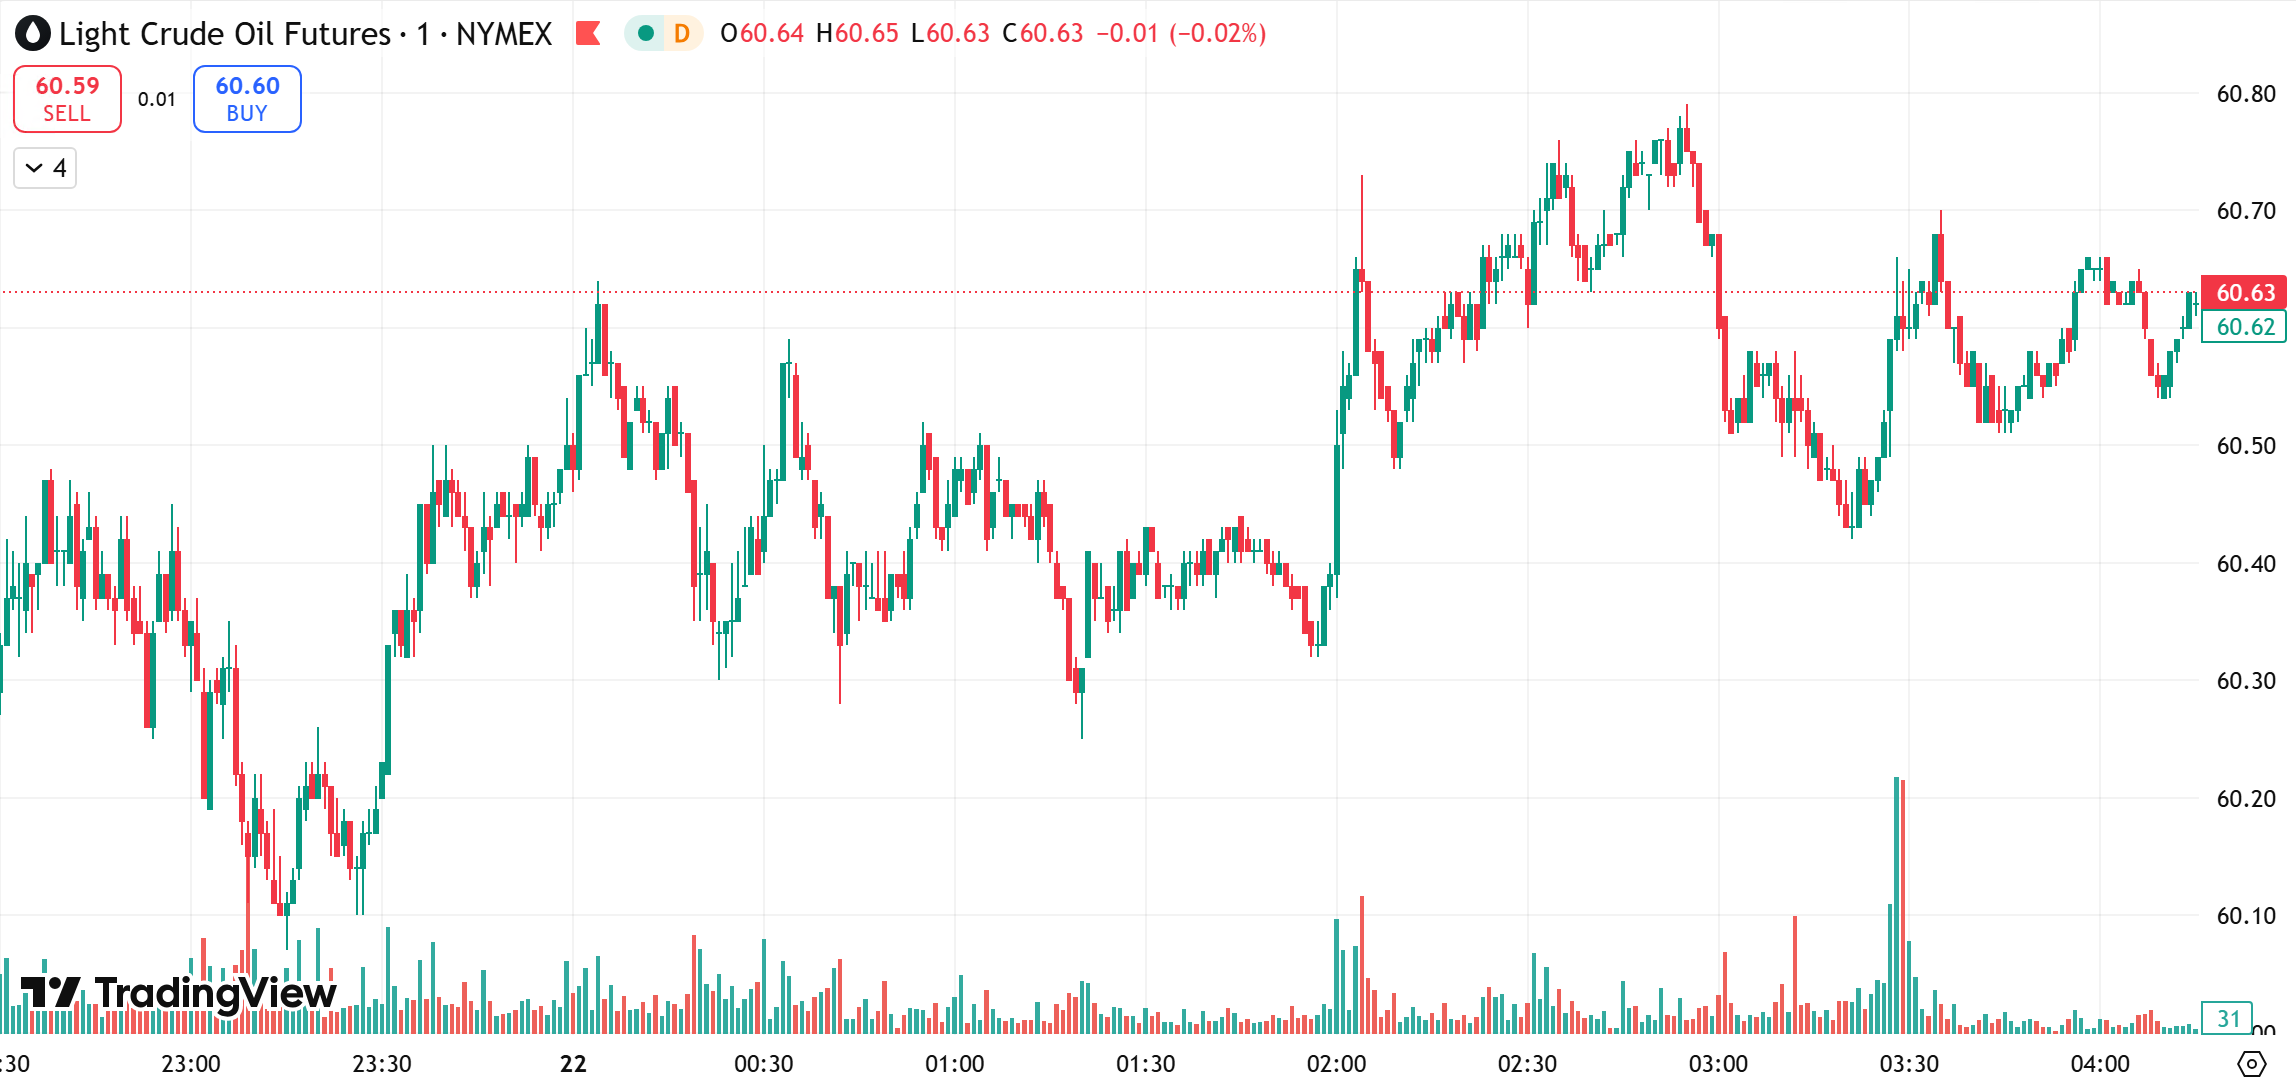
On the daily chart, oil remains in a broad consolidation after rebounding from the $54.80 area. Price has moved above key moving averages, shifting the medium-term trend into a range-bound structure. While the break above $60.50 is encouraging, follow-through remains uncertain, leaving room for a pullback.
On the 1-hour chart, oil is stabilizing near the upper end of the range, with MACD holding above the zero line, signaling bullish momentum. Short-term moving averages are aligned to the upside, suggesting the potential for another push higher if momentum holds.
Today’s Focus:
Strategy: Buy dips, sell rallies cautiously.
- Upside resistance: 62.0–63.0
- Downside support: 59.0–58.0
Risk Disclosure
Trading in Securities, Futures, contracts for difference (CFDs) and other financial products carries high risks due to the rapid and unpredictable fluctuation in the value and prices of these financial instruments. This unpredictability is due to the adverse and unpredictable market movements, geopolitical events, economic data releases, and other unforeseen circumstances. You may sustain substantial losses including losses exceeding your initial investment within a short period of time.
You are strongly advised to fully understand the nature and inherent risks of trading with the respective financial instrument before engaging in any transactions with us. When you engage in transactions with us, you acknowledge that you are aware of and accept these risks. You should conduct your own research and consult with an independent qualified financial advisor or professional before making any financial, trading or investment decisions. This blog may contain speculative statements regarding future expectations, plans, or projections based on information and assumptions currently available to D Prime. Although D Prime considers these assumptions reasonable, such statements involve risks, uncertainties, and factors beyond D Prime’s control, and actual outcomes may differ significantly.
Disclaimer
This information contained in this blog is for general informational purposes only and should not be considered as financial, investment, legal, tax or any other form of professional advice, recommendation, an offer, or an invitation to buy or sell any financial instruments. The content herein, including but not limited to data, analyses and market commentary, is presented based on internal records and/or publicly available information and may be subject to change or revision at anytime without notice and it does not consider any specific recipient’s investment objectives or financial situation. Past performance references are not reliable indicators of future performance.
D Prime and its affiliates make no representations or warranties about the accuracy or completeness or reliability of this information and disclaim any and all liability for any direct, indirect, incidental, consequential, or other losses or damages arising out of or in connection with the use of or reliance on any information contained in this blog. The above information should not be used or considered as the basis for any trading decisions or as an invitation to engage in any transaction. Do not rely on this report to replace your independent judgment. You should conduct your own research and consult with an independent qualified financial advisor or professional before making any financial trading or investment decisions.

